There are basically three major factors that influence and affect forex market trends - economy, political conditions and market psychology.
1. Economy
Economic factors are the most basic things that create changes in a country's currency. When such economic conditions as a budget deficit or surplus is present within a country, there will surely be reactions in the market and values will be reflected on currencies. Other conditions may also include inflation trends, and the general economic growth of the country.
The more prosperous a country's economy is, the more investors will be able to adhere to doing trade in a more positive attitude. Such indicators as a growth in a nation's gross domestic product (GDP), employment levels and retail sales among others will basically attract more investors and that nation's currency value will likely go up.
2. Political Conditions
Another very important factor that influence trends in Forex, are the conditions of a country's political sector. This is because political instability or turmoil can generally create negative fluctuations to an economy. But if such instances occur wherein a country may rise above political obstacles, the opposite may occur and the economy may improve.
Events in a region can surely create negative or positive interest among investors for a nation's currency. And so, such conditions surely influence the trends for demands and prices of a certain currency.
3. Market Psychology
Of course, the perception of traders and investors will greatly influence the Foreign Exchange market in so many ways. After all, the market is highly dependent on whether or not people would want to invest on a country's economy in order to determine whether currency prices will go up or down.
For example, such conditions wherein unsettling international events may happen, people would generally want to look for a safe haven for their investments. Whenever there is a greater demand for a certain country's economy, then a higher price will be given to buyers and the currency's value will go up and become stronger.
Other events that contribute to traders perceptions may be long-term trends where people invest based on what they have seen for a long period and time, and even economic numbers where people may base their investments depending on what numbers show a greater value.
The market in Foreign Exchange is often unpredictable and fluctuating. Therefore if you are interested in doing trades in this market, make sure that you take the time to be knowledgeable about good strategies that can help you play the game.
But more importantly, keep in updating yourself with the different economic trends in the international scene. After all, this currency market would greatly revolve upon events that would occur in the different countries. Familiarizing yourself with the factors that affect the Forex will surely help you make better decisions.
How to Identify Forex Market Trends
Trend is simply the overall direction in which prices are moving - UP, DOWN, OR FLAT.
Types of Trends
The direction of the trend is absolutely essential to trading and analyzing the market. In the Foreign Exchange (FX) Market, it is possible to profit from both UP and Down movements, because the buying and selling of one currency is always linked to another currency e.g. BUY US Dollar SELL Japanese Yen (USD/JPY).
Trend Classifications
Information About Trendlines
The basic trendline is one of the simplest technical tools employed by the trader, and is also one of the most valuable in any type of technical trading. For an up trendline to be drawn, there must be at least two low points in the graph, where the 2nd low point is higher than the first. A price low is the lowest price reached during a counter trend move.
Trend Analysis and Timing
Markets don't move straight up and down. The direction of any market at any given time is either Bullish (Up), Bearish (Down), or Neutral (Sideways). Within those trends, markets have countertrend (backing & filling) movements. In a general sense "Markets move in waves", and in order to make money, a trader must catch the wave at the right time.
Drawing Trendlines
Trendlines I
Drawing Trendlines will help to determine when a trend is changing
Trendlines II
Trendlines show support boundaries under prices. These boundaries may be used as buying areas.
Trendlines III
Temporary trendline penetrations are not as significant as a close beyond the trendline.
Channel Lines
When prices remain within two parallel trendlines they form a Channel. When prices hit the bottom trendline this may be used as a buying area. Similarly, when prices hit the upper trendline this may be used as a selling area.
Find Price Support Levels
Price supports are price areas where traders find it is difficult for market prices to penetrate any lower. Buying interest in the dollar is strong enough to overcome Selling interest in the dollar, keeping prices at a sustained level.
Finding Price Resistance Levels
Resistanceis the opposite of support, representing a price level where Selling Interest overcomes Buying interest and advancing prices are turning back.
50% Retracements
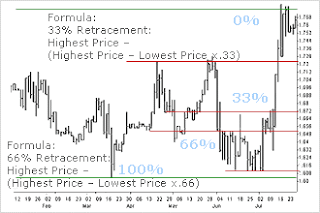
33% and 66% Retracements
Sources :
- Paul Hata: Factors That Influence Forex Market Trends
- Technical Analysis: What is Market Trend?


