Monday, December 8, 2008

How to Identify Forex Market Trends

There are basically three major factors that influence and affect forex market trends - economy, political conditions and market psychology.

1. Economy
Economic factors are the most basic things that create changes in a country's currency. When such economic conditions as a budget deficit or surplus is present within a country, there will surely be reactions in the market and values will be reflected on currencies. Other conditions may also include inflation trends, and the general economic growth of the country.

The more prosperous a country's economy is, the more investors will be able to adhere to doing trade in a more positive attitude. Such indicators as a growth in a nation's gross domestic product (GDP), employment levels and retail sales among others will basically attract more investors and that nation's currency value will likely go up.

2. Political Conditions
Another very important factor that influence trends in Forex, are the conditions of a country's political sector. This is because political instability or turmoil can generally create negative fluctuations to an economy. But if such instances occur wherein a country may rise above political obstacles, the opposite may occur and the economy may improve.

Events in a region can surely create negative or positive interest among investors for a nation's currency. And so, such conditions surely influence the trends for demands and prices of a certain currency.

3. Market Psychology
Of course, the perception of traders and investors will greatly influence the Foreign Exchange market in so many ways. After all, the market is highly dependent on whether or not people would want to invest on a country's economy in order to determine whether currency prices will go up or down.

For example, such conditions wherein unsettling international events may happen, people would generally want to look for a safe haven for their investments. Whenever there is a greater demand for a certain country's economy, then a higher price will be given to buyers and the currency's value will go up and become stronger.

Other events that contribute to traders perceptions may be long-term trends where people invest based on what they have seen for a long period and time, and even economic numbers where people may base their investments depending on what numbers show a greater value.

The market in Foreign Exchange is often unpredictable and fluctuating. Therefore if you are interested in doing trades in this market, make sure that you take the time to be knowledgeable about good strategies that can help you play the game.

But more importantly, keep in updating yourself with the different economic trends in the international scene. After all, this currency market would greatly revolve upon events that would occur in the different countries. Familiarizing yourself with the factors that affect the Forex will surely help you make better decisions.

How to Identify Forex Market Trends

Trend is simply the overall direction in which prices are moving - UP, DOWN, OR FLAT.

Chart Courtesy Forex Yard

Types of Trends

The direction of the trend is absolutely essential to trading and analyzing the market. In the Foreign Exchange (FX) Market, it is possible to profit from both UP and Down movements, because the buying and selling of one currency is always linked to another currency e.g. BUY US Dollar SELL Japanese Yen (USD/JPY).

Chart Courtesy Forex Yard
Up Trend. As the trend moves upwards the US Dollar is appreciating in value.

Chart Courtesy Forex Yard
Down Trend. As the trend moves downwards the US Dollar is depreciating in value.

Chart Courtesy Forex Yard
Sideways Trend. Prices are moving within a narrow range (The currencies are neither appreciating nor depreciating).

Trend Classifications

Chart Courtesy Forex Yard

Information About Trendlines

The basic trendline is one of the simplest technical tools employed by the trader, and is also one of the most valuable in any type of technical trading. For an up trendline to be drawn, there must be at least two low points in the graph, where the 2nd low point is higher than the first. A price low is the lowest price reached during a counter trend move.

Chart Courtesy Forex Yard

Chart Courtesy Forex Yard

Trend Analysis and Timing

Markets don't move straight up and down. The direction of any market at any given time is either Bullish (Up), Bearish (Down), or Neutral (Sideways). Within those trends, markets have countertrend (backing & filling) movements. In a general sense "Markets move in waves", and in order to make money, a trader must catch the wave at the right time.

Chart Courtesy Forex Yard

Chart Courtesy Forex Yard

Drawing Trendlines

Chart Courtesy Forex Yard

Trendlines I

Drawing Trendlines will help to determine when a trend is changing

Chart Courtesy Forex Yard

Trendlines II

Trendlines show support boundaries under prices. These boundaries may be used as buying areas.

Chart Courtesy Forex Yard

Trendlines III

Temporary trendline penetrations are not as significant as a close beyond the trendline.

Chart Courtesy Forex Yard

Channel Lines

When prices remain within two parallel trendlines they form a Channel. When prices hit the bottom trendline this may be used as a buying area. Similarly, when prices hit the upper trendline this may be used as a selling area.

Chart Courtesy Forex Yard

Find Price Support Levels

Price supports are price areas where traders find it is difficult for market prices to penetrate any lower. Buying interest in the dollar is strong enough to overcome Selling interest in the dollar, keeping prices at a sustained level.

Chart Courtesy Forex Yard

Finding Price Resistance Levels

Resistanceis the opposite of support, representing a price level where Selling Interest overcomes Buying interest and advancing prices are turning back.

Chart Courtesy Forex Yard

50% Retracements

Chart Courtesy Forex Yard

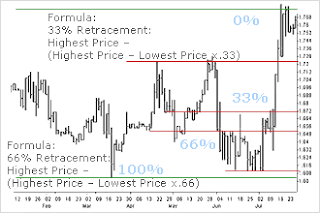
33% and 66% Retracements

Chart Courtesy Forex Yard


Sources :
  1. Paul Hata: Factors That Influence Forex Market Trends
  2. Technical Analysis: What is Market Trend?

Bookmark and Share Join My Community at MyBloglog! Add to Technorati Favorites Stumble Upon Toolbar

Guide to Using Fibonacci Retracements Level

The Fibonacci retracements pattern can be useful for swing traders to identify reversals on a forex chart. On this page we will look at the Fibonacci sequence and show some examples of how you can identify this pattern.

Fibonacci Retracement Levels are:
0.382, 0.500, 0.618 — three the most important levels
Fibonacci retracement levels are used as support and resistance levels.

Fibonacci Extension Levels are:
0.618, 1.000, 1.618 — three the most important levels
Fibonacci extension levels are used as profit taking levels.

To set up Fibonacci on the chart we need to find out:

  1. Is it uptrend or downtrend?
  2. Highest and lowest swings in the chart formation (A, B points). And go with the trend!
Fibonacci SwingWe have an uptrend. A — our lowest swing, B — our highest swing. So, we will look to BUY some lots at the good lowest price and go up with the trend.

So, what we are expecting is next: the price should retrace (go down) from point B to some point C, and then continue up in the direction of the trend. Those three dotted lines (0.618, 0.500, 0.382) at the bottom on our picture shows three Fibonacci retracement levels where we expect the price to take a U-turn and go up again. There we will place our BUY order.

The best situation would be to buy at the lowest level — 0.618 — point C. And on practice the price usually gives us this chance. However, 0.500 is also a good level to place a BUY order.

Fibonacci Retracement
Same steps will also apply to downtrend price movement.

Fibonacci RetracementForex will often pull back or retrace a percentage of the previous move before reversing. These Fibonacci retracements often occur at three levels – 38.2%, 50%, and 61.8%. Actually, the 50% level really does not have anything to do with Fibonacci, but traders use this level because of the tendency of forex to reverse after retracing half of the previous move. Here is an example using a graphic explaining the retracement pattern.

Fibo Retracements LevelThis picture shows a graphical representation of the reversal points for forex in an uptrend.

After a forex makes a move to the upside (A), it can then retrace a part of that move (B), before moving on again in the desired direction (C). These retracements or pullbacks are what you as a swing trader want to watch for when initiating long or short positions.

Once the forex begins to pull back (retrace), then you can plot these retracement levels on a chart to look for signs of a reversal. You do not automatically buy the forex just because it is at a common retracement level! Wait, and look for candlestick patterns to develop at the 38.2% area. If you do not see any signs of a reversal, then it may go down to the 50% area. Look for a reversal there. You do not know if or when the forex will reverse at a Fibonacci level! You just mark these areas on a chart and wait for signal to go long or short.

Just remember...
Price is king. Wait for signs of a reversal before you initiate a trade!


Sources :
  1. Fibonacci method in Forex charts.
  2. How To Use Fibonacci Retracements.

Bookmark and Share Join My Community at MyBloglog! Add to Technorati Favorites Stumble Upon Toolbar

Saturday, December 6, 2008

How to Profit from Fibonacci Retracements in Forex

Fibonacci Retracements are probability points where a currency, or stock will "bounce back" to, after a large move, and then continue in the original direction. Think of Retracements in terms of Newton's Laws of Motion: "For every action there is an equal and opposite reaction."

Within this understanding, trading carries some of the same principals. However, I would like to add that after a large move, the opposite reaction loses energy quickly, and thus, is often why the 'reactive move' after a large move, is often less than the large move itself.

Ironically, Leonardo Fibonacci lived in the 13th century, while Newton worked in the 17th century. Perhaps Fibonacci unknowingly uncovered truth behind Newton's laws, centuries before Newton even came up with them.

Fibonacci in Nature

If you're not familiar with Fibonacci ratios and numbers the concepts are directly derived from nature and are found in virtually all organic sciences today. Basically, Fibonacci numbers are resultant from adding the previous together to find the next. For example 1+1=2, 2+1=3, 3+2=5, 5+3=8 and so on. The Fibonacci string would look like: 0,1,1,2,3,5,8,13,21,34,55,89,144,233...

In nature, the spiral of seeds in a sunflower are exactly ordered in Fibonacci sequence, as with many occurrences in organic life.

Fibonacci ratios are also derived from the numerical sequence. For example, if you take any eighth number in the sequence and divide it by the number following it in the sequence (dividing the eight by the ninth), the answer will ALWAYS be 61.8. In the above string, if we divide the eighth number (21) by the ninth (34), we get 61.76, or 61.8 rounded up.

It just is, that's why.

Market quants hold that Fibonacci is not only true in organic matter, but within the market itself, and Fibonacci ratios, more often than not, lay out of a map for retracement levels, after a significant move. Thus, perhaps Newton's Law of Motion that says, "For every action there is an equal and opposite reaction" failed to take into account the loss of energy in reaction, something that may be solved with Fibonacci ratios. I believe there would be another factor involved though, which may be overcome combining the founder of quantum physics Max Karl Ernst Ludwig Planck's formula, where "energy is and absorbed in quantities divisible by discrete 'energy elements'" and simple Fibonacci.

Perhaps someday I will make an attempt to prove my instincts in math. Before I get sidetracked (which is way too easy) any further though, let's look into how you can - very simply - use Fibonacci Retracements in Forex trading.

Fibonacci in Forex - The Self Fulfilling Prophecy

All of the magical math in the world will never make Fibonacci retracements true 100% of the time. Period. Thus, a little common sense goes a long way when using any type of mathematical, or technical indicator to trade from. If the market is showing something different than the indicator, enough people believe in something different that the indicator is wrong. Fibonacci retracements are only good so long as enough people are watching and acting on the same information that the collective whole makes the occurrence a self-fulfilling prophecy. What I'm saying is that even if you've opened a trade based on Fibonacci retracement expectations, be prepared to close the position, should common sense warrant such.

With the aforementioned in mind, Fibonacci Retracements work on both short and long-term time frames for all types of traders. For this article, we will only look at short-term trading with 4-hour charts.

First, before we even consider a Fibonacci retracements, you need to be able to spot when a move has occurred that would warrant using Fibonacci Retracements. This can be as simple as looking at a chart, and visually seeing that a large move has transpired - and capitulated. What I mean by this is, if when looking at a chart you're expecting to see empirical proof that a move has stalled, you will never be able to do so. You will see some signs, like MACD or Stochastics bottoming out, or a candlestick pattern like a hammer bottom, but you will never know for sure. One way to have a slight bit of assurance though, is to look for candlestick confirmation, something I recently covered in my article Why Confirmation Counts.

Regardless, only countless hours of pouring over charts will give you 'the feel'. Once you are able to infer a move is over, you can begin to apply Fibonacci retracements for profit targets points if you are trying to trade the rebound, or for new entries, if you are waiting to get back into the currency, for a continued move in the same direction, as the previous 'large move.'

The below chart shows a significant move that recently occurred when the U.S. dollar sold off against the Swiss franc. Based on this chart, many traders were likely looking for a retracement. Some turned the dollar long, others waited for key retracement levels to be hit before taking positions.

Forex Fibonacci
Now, let me show you how you can trade a 'reversal' using Fibonacci, after a large move.

In the below chart, you will see a large downward move, where the Australian dollar declined significantly against the New Zealand dollar. Several indicator (not shown) displayed that a reversal was looming, thus perceptive traders would have taken a long position in the Australian dollar, using the low of the range as a stop. The AUD quickly rebounded, touching the 38.2 retracement within 12 hours of the low. However, it sold off again (twice actually) before making another run at the 50% retracement. Jittery traders would have been shaken out for sure; however, those with steadfast stops just below the low of the original moves would have not. (You must decide for you whether you will trade for larger moves, or quickly scalp profits any time the market makes a sudden moves. It is my experience that traders who take small profit after small profit and cannot hold for larger wins, eventually get killed when they take a bigger loss. Truly great traders know one of the keys to success is: little loss, little loss, big win, not vice versa.)

Forex Fibonacci
Regardless, those who were able to hold, would have seen the AUD/NZD briefly pop above the 50% retracement a few days after the initial move occurred. Here's one way to solve the problem previously shown by failure at the 38.2% retracement. When trading a reversal, set your stop as soon as you make the trade. Then, set a sell order for one quarter of your position at the 38.2% Fibonacci retracement, so if the trade fails, you will have a small buffer when your stop is hit on the downside. (You will need to adjust the position size in your stop, if the 38.2% retracement is hit, accounting for the 25% of your position you just sold for a profit.) At the same time you made the initial trade, set a sell order for 50% of the total initial position at the 50% retracement. In the case of AUD/NZD, when the pair first hit the 50% retracement, you would have taken even more off the table…and would need to adjust your stop order accordingly, as you will now only have 25% of the original position. Then, with the remaining 25%, you can set another order to sell at the 61.8% retracement, or let it ride. FYI, from my experience trading Forex, the 50% retracement mark seems to hold the most weight, If a pair does not reverse the bounce after the large move, and you see a 4-hour bar close above the 50% retracement, there's a good chance the pair will retrace the whole move. I'm not sure why, but from what I've seen the 61.8% retracement seems to hold less weight than the 50% retracement, at least when using 4-hour charts.

Regardless, the retracements serve as profit targets for reversal trades.

For traders who think the pair will continue the original move, you can place your orders at the Fibonacci retracement points, where you hope to reenter in the direction of the big-move trend. One way to do so is place an order for 25% of your total predetermined size at the 38.2% mark, 50% at the 50% mark and 25% at the 61.8% mark… This way, you've allowed yourself 'wiggle room' if the 38.2% and 50% retracements do not hold. It's important to note though, that if the 61.8% retracement is breached, the pair will likely retrace the entire move, something that happens often in Forex trading. The best rule of thumb in this case is as simple as the old market saying: When in doubt, get out.


Sources :

  1. How to Profit from Fibonacci Retracements in Forex Trading

By:
Mark Whistler is the founder of www.WallStreetRockStar.com and is the author of multiple books on trading. Mark's newest book, The Swing Trader's Bible - co-authored with CNBC/Fox News regular guest Matt McCall - will be on shelves in late summer, 2008. In addition, Mark also writes regularly for TraderDaily.com and Investopedia.com.

Bookmark and Share Join My Community at MyBloglog! Add to Technorati Favorites Stumble Upon Toolbar

Wednesday, December 3, 2008

So why does Fibonacci work in the Forex market?

Because Fibonacci ratios are a deeply ingrained part of the Forex culture. Big banks, hedge funds, and individual traders alike all pay close attention to these ratios, and frequently place their orders at Fibonacci retracement levels.

If enough orders accumulate at a particular level, the combined power of these orders can actually change the direction of the exchange rate when that level is achieved. This is the essence of the self-fulfilling prophecy that we discussed in last week's newletter.

If my assumption is correct that Fibonacci works in the Forex market not because of magic but due to a self-fulfilling prophecy, then there are certain conclusions that we can extrapolate from this premise:

Fibonacci Is More Effective on Longer-Term Charts
If we truly believe that Fibonacci is a self-fulfilling prophecy, then we should live by the credo, "the more, the merrier." In other words, the more orders that are placed at a particular level, the more likely it becomes that the level will hold as support or resistance.

What can improve the chances that there will be a large quantity of orders at a particular Fib level? Visibility is the key. If the other players can't see the Fib level, they can't place their orders accordingly.

For example, if a Fibonacci level forms on a five-minute chart during the Asian trading session, any opportunity to place a trade based on this retracement is likely to come and go before European and American traders have wiped the sleep from their eyes. Since many of these traders will never observe this opportunity, there will be fewer orders placed at that level. This makes it less likely that the level will hold when the price reaches that area.

However, if the same scenario occurs on the daily chart, traders all around the world will have the time and the opportunity to place their orders accordingly. Since Forex is truly an international market, with traders located on every part of the globe, this aspect of Fibonacci trading takes on added significance.

Fibonacci Is More Effective on Commonly Used Retracement Levels
The most commonly used Fibonacci ratios are 38.2%, 50%, and 61.8%. However, 23.6%, 78.6% and 100% are also legitimate Fib levels. Some traders even use Fibonacci "extensions" that go beyond 100%, such as a 161.8% retracement. There are also Fibonacci Arcs, Fibonacci Fans, and Fibonacci Time Zones.

Which of these techniques will be the most effective? If we truly believe that a sizable quantity of orders (or a quantity of sizable orders) will make the difference, then we must give more weight to the levels that garner the most attention - the 38.2%, 50%, and 61.8% levels. In Fibonacci, as in many aspects of trading, sometimes it's better to keep things simple.

Bookmark and Share Join My Community at MyBloglog! Add to Technorati Favorites Stumble Upon Toolbar

Improving your trading by thinking less

Forex Earn CashAnalysis paralysis. We’ll all heard of it. Have we all experienced it? I know I have.

My personal tendency in all aspects of life is to be very analytic. That has some nice advantages, but it also as some nasty drawbacks at times as well. I’ve been told on more than one occasion that I think too much, and while it was not normally meant to be a deragatory thing, it is indicative. I do think alot, and probably would be considered by many an intellectual - for better or worse.

The "worse" part is something I became aware of many years ago, early in my professional career as an analyst. My job required me to product commentary quite frequently. It was actually too frequently in many respects because I found that by being forced to revisit the price action I wasn’t able to allow the market moves I had previously outlined to properly develop. I was instead coming up with new analysis at each point, often to the detriment of producing quality trading ideas.

This is something which has from time to time carried over into my trading as well. There have been spells where I have allowed myself to get sucked way into the fine details of things. Sometimes I catch myself before much damage is done, but often it ends up becoming a hindsight sort of thing. Basically, the more I think about trading, the less well I tend to do, which is definitely part of why I’ve tended to perform better taking longer-term positions where the decision-making is more spread out and less at risk of turning into over-thinking.

The funny aspect to this whole situation is a bit of a paradox. I find that my gut generally gives me the right read, but if I consciously check my gut it nullifies things. In other words, I can’t think about what my gut is telling me. I just have to accept it’s influence when it chooses to speak up.

And by the way, the gut thing is something I definitely believe to be reflective of experience. It’s not something people are just born with. It’s a question of having seen the patterns of how the markets move many, many times such that your waking mind doesn’t even have to register them at all. This tends to go along the lines with how expertise comes from frequency of repetition, not time.

My point in sharing these things is to encourage you to look at your own work in the market to see whether you might be over-thinking things to your detriment at times.


Sources :

  1. John Forman - The Essentials of Trading author (Improving your trading by thinking less)

Bookmark and Share Join My Community at MyBloglog! Add to Technorati Favorites Stumble Upon Toolbar
Template by - Abdul Munir | Daya Earth Blogger Template